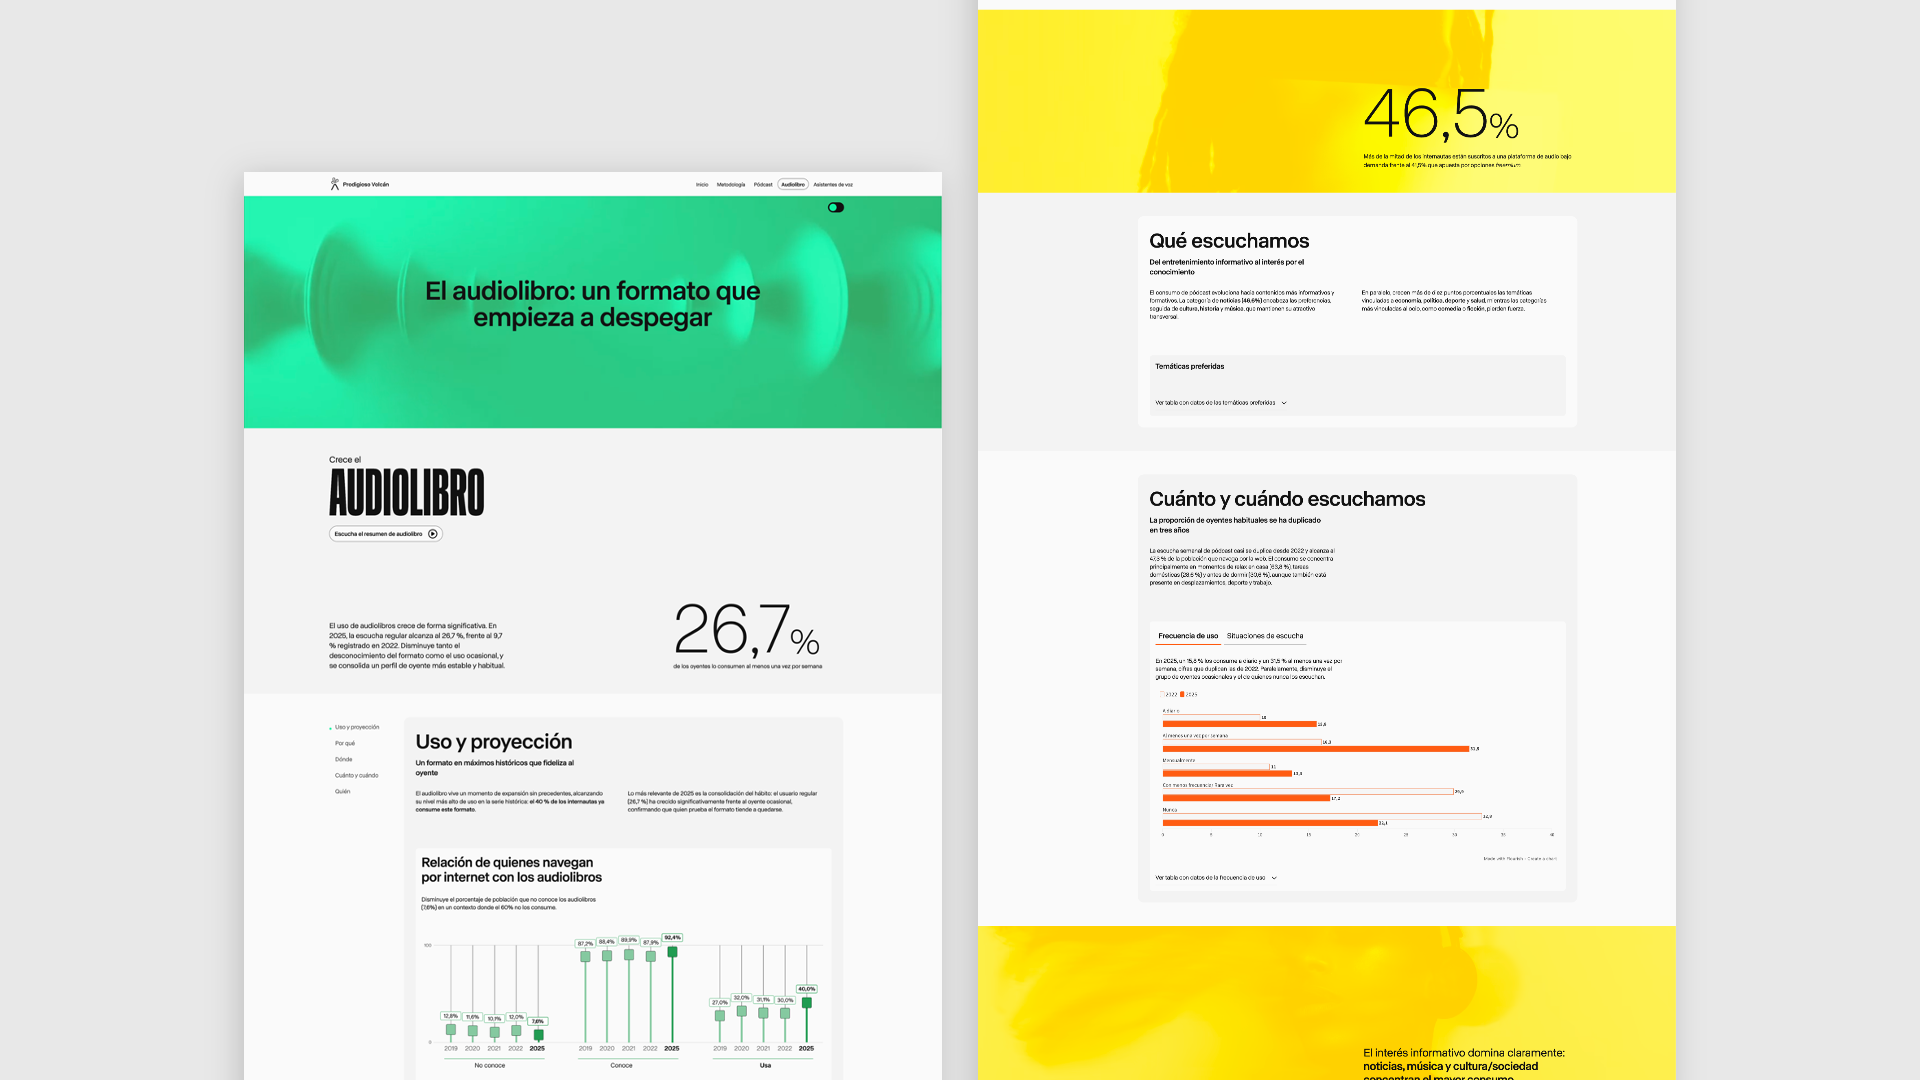
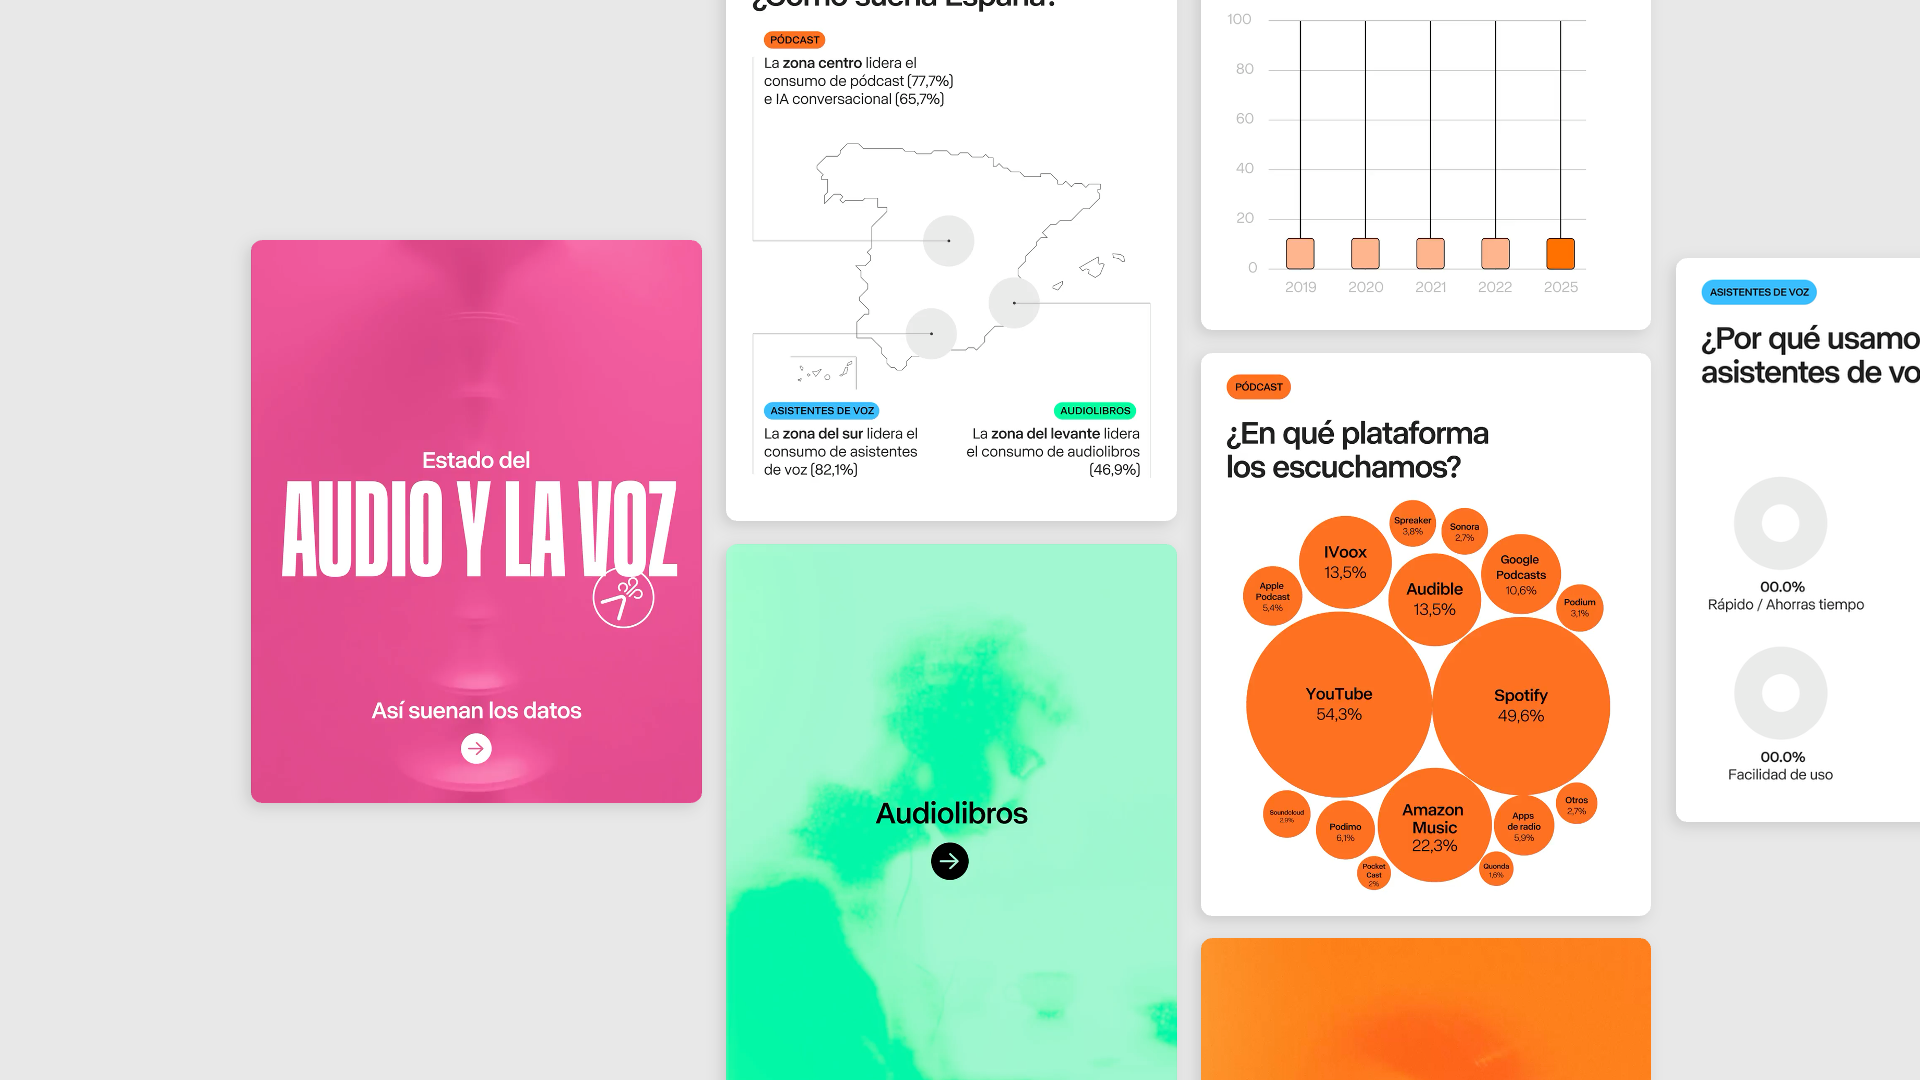
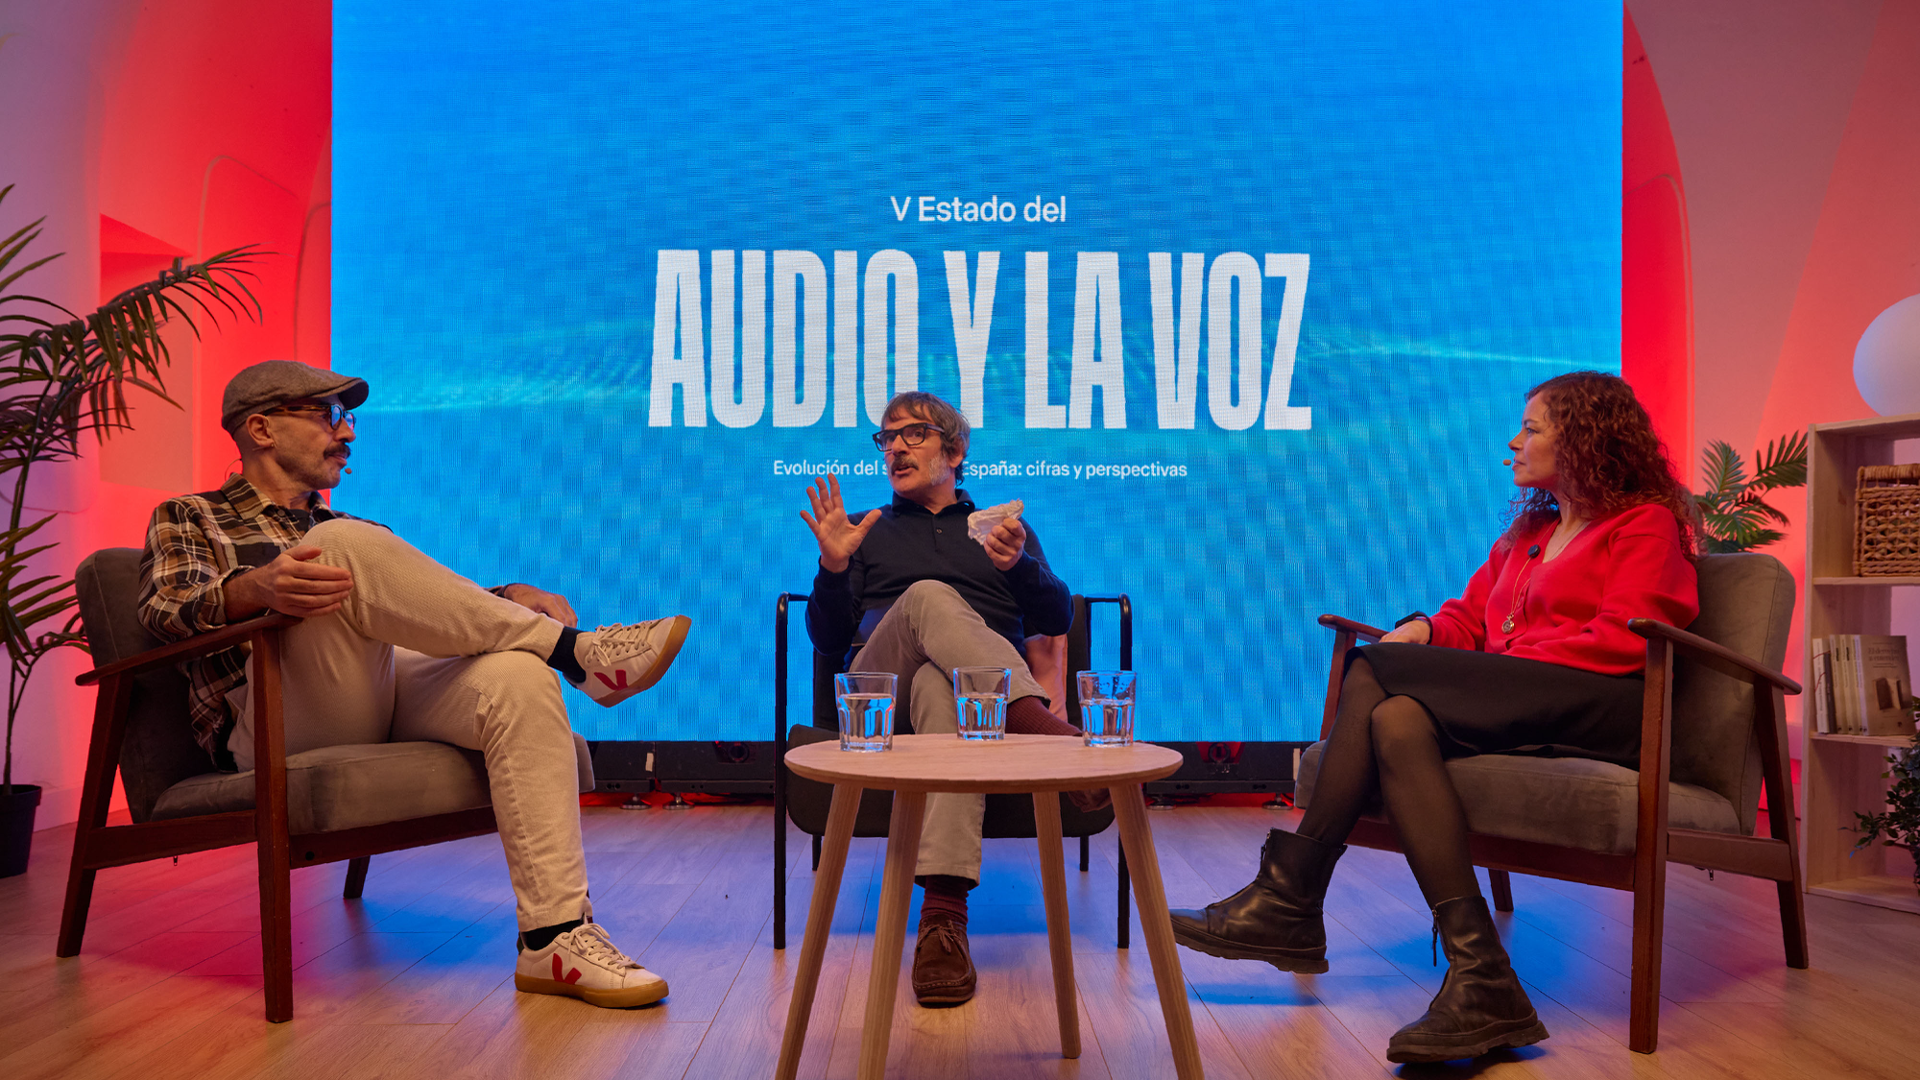
Every year, Prodigioso Volcán and the market research firm SEIM map Spain’s podcast, audiobook and voice assistant landscape. The report is an industry study and also the best way to reach potential clients in the sector. The previous edition won a Webby and a LAUS by pairing audio-inspired infographics with hand-made illustration, so the V edition started from a high bar and had to take that idea further.
An audio industry report that plays.
My role
I led the art direction almost on my own, with UX/UI guidance from Pilar Labanda along the way. My job was to coordinate a large group of designers, infographic designers and motion designers, and to combine their authorship and creative ideas into a single, coherent report.
Process
Making dense data feel light
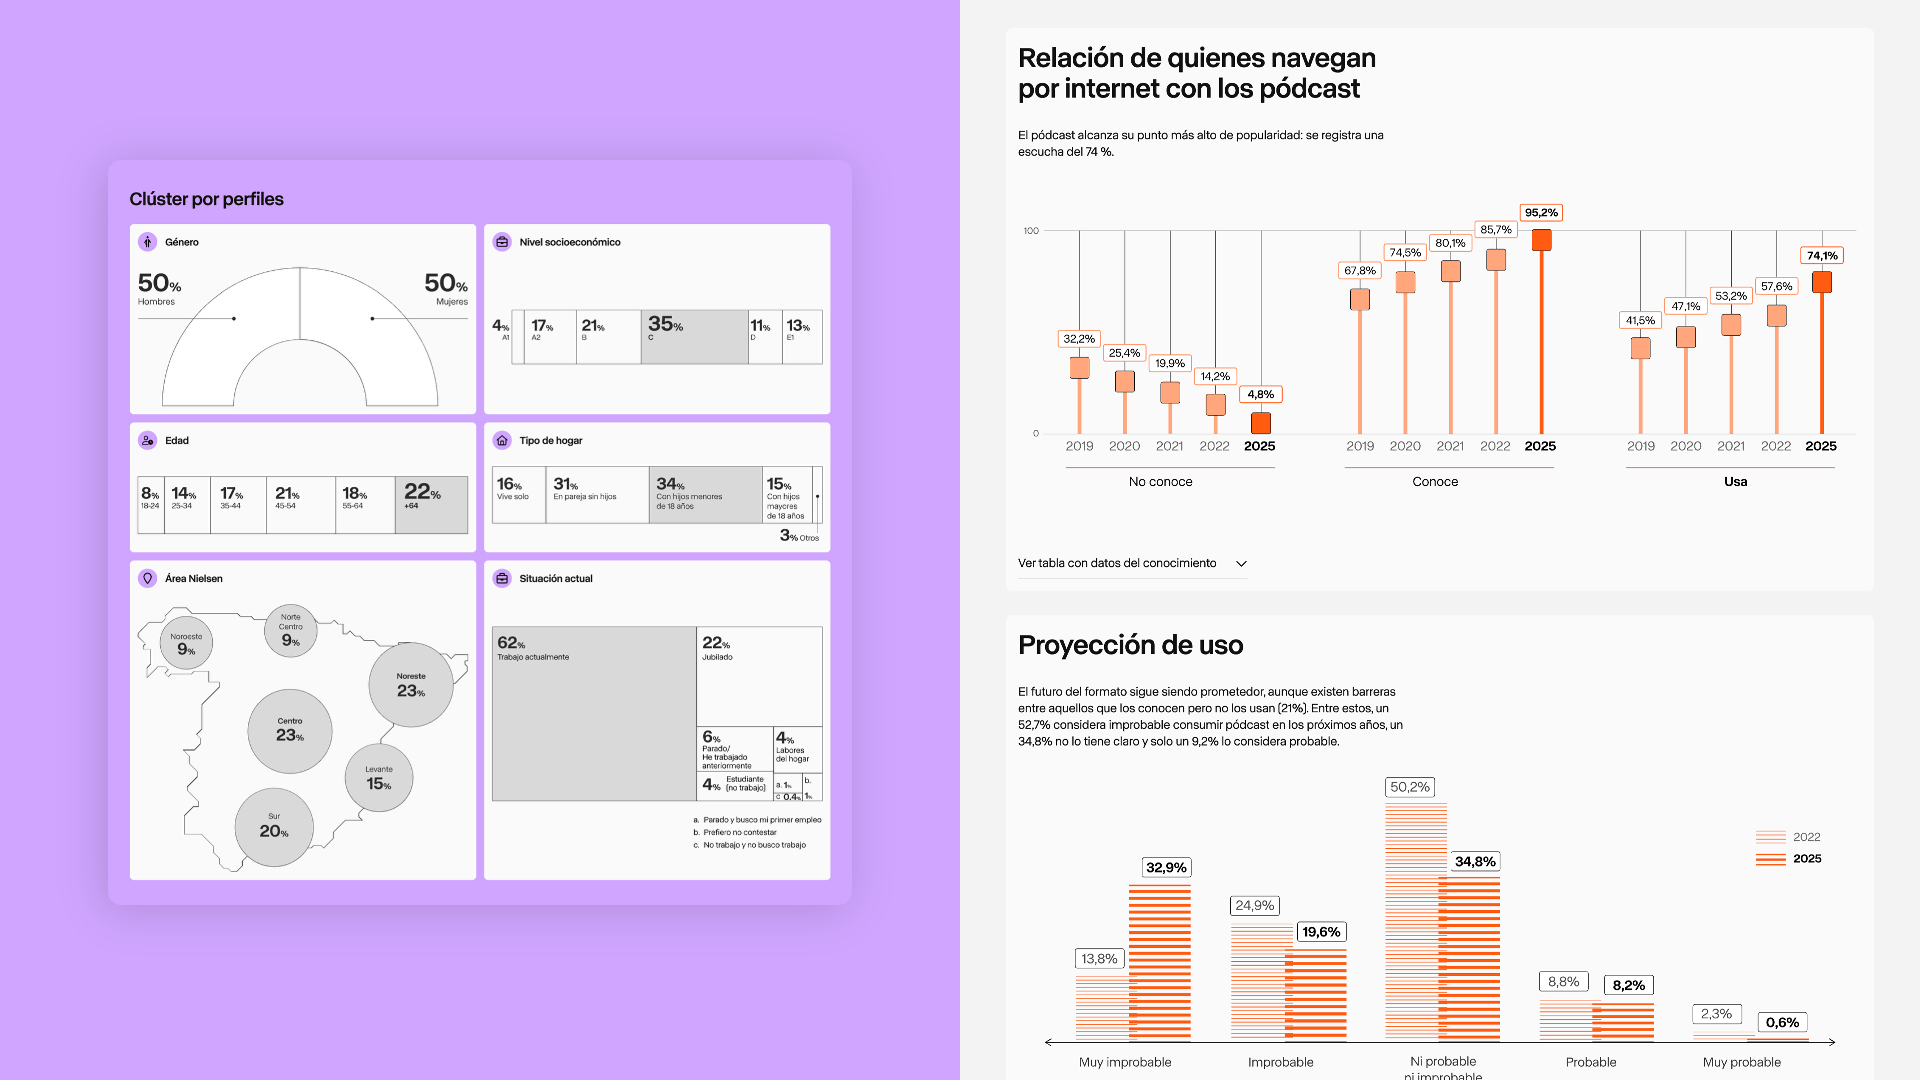
A report built on 750 SEIM interviews has to hold a lot of numbers without becoming a wall of charts. The work was a constant negotiation between data, text and imagery, with accessibility pushed further than data-heavy reports usually go, so the interactive charts and filtered views stay usable. Motion and interactivity slowed the report down, so I found and implemented a script that fixed performance and kept every animation.
If it's about audio, it should sound like something
A report about podcasts, audiobooks and voice assistants with no audio in it made no sense to me. I proposed a real audio player inside the report, while the animation team created the synthetic voice that narrates it. The methodology section opens with a short test that sorts each reader into one of three profiles, Desconfiados, Cautelosos or Tech-Optimistas, so the report can speak differently to a skeptic of voice assistants than to someone who lives inside them. I built both with Claude, with no developer needed.
A report built on 750 SEIM interviews has to hold a lot of numbers without becoming a wall of charts. The work was a constant negotiation between data, text and imagery, with accessibility pushed further than data-heavy reports usually go, so the interactive charts and filtered views stay usable. Motion and interactivity slowed the report down, so I found and implemented a script that fixed performance and kept every animation.
If it's about audio, it should sound like something
A report about podcasts, audiobooks and voice assistants with no audio in it made no sense to me. I proposed a real audio player inside the report, while the animation team created the synthetic voice that narrates it. The methodology section opens with a short test that sorts each reader into one of three profiles, Desconfiados, Cautelosos or Tech-Optimistas, so the report can speak differently to a skeptic of voice assistants than to someone who lives inside them. I built both with Claude, with no developer needed.
Result
Built on the structure that won a Webby and a LAUS for its predecessor, the V edition pushed the format further. It solved its performance limits and added a new layer: real sound, inside a report about sound.
-
Agency
Prodigioso Volcán -
Art direction
Carlos Heyd / Pilar Labanda -
Infographics
Blanca Rogel -
AnimationsPedro Mato
-
ContentsSara Pedraz / SEIM